TL;DR
This post is a dive into the results and methodology of our large scale evaluation of generative text-to-image AI models. The detailed paper is available at https://arxiv.org/abs/2409.11904 The short, boiled down version is as follows:
- Efficiently evaluating the performance of text-to-image models is difficult as it inherently requires subjective judgment and human preference, making it hard to compare models from different providers.
- We present an annotation framework based on Rapidata’s technology that enables efficient sourcing of human feedback on text-to-image model outputs from a diverse set of annotators.
- We collect more than 2 million annotations across 4512 images and three criterias; style, coherence, and text-to-image alignment.
- We show that the regional distribution of our diverse annotators closely resembles the distribution of the world population ensuring lower risk of biases.
- We present the ranking between the currently most well known image generation models; DALLE-3, Flux.1, MidJourney, and Stable Diffusion.
Introduction
Text-to-image models like DALL-E 3, Stable Diffusion, MidJourney, and Flux.1 have gained popularity for generating images from text prompts. However, benchmarking these models is challenging due to the subjective nature of image quality assessment. Unlike other areas of deep learning with standardized benchmarks, text-to-image models lack a reliable, unified evaluation method. This makes it difficult to compare new models and quantify the state-of-the-art.
Current evaluation approaches include human panels and AI models trained on human preferences [1,2,3,4], but these have limitations. Human evaluations can be small-scale and biased, while AI models may perpetuate biases and struggle with nuanced assessments.
Rapidata introduces a new evaluation paradigm, accessing a diverse global pool of annotators to provide large-scale, representative human feedback. This approach aims to create the first comprehensive, repeatable benchmark for text-to-image generation, offering:
- A novel annotation process for collecting human preferences at scale.
- A curated set of 282 image generation prompts covering various evaluation criteria.
- A ranking of major text-to-image models based on 2 million human preferences across 4512 generated images.
This benchmark surpasses existing evaluations in scope and scale, providing a more robust assessment of text-to-image model performance.
Benchmark and Annotation Framework
The benchmark is designed to evaluate the quality of text-to-image outputs over a range of meaningful settings based on three criteria common in literature [1, 5] – Style, Coherence, and Text-to-Image alignment. Concretely, this is done by presenting annotators with two generated images and asking them to select the best option based on one of the following questions respectively:
-
Which image do you prefer?
-
Which image is more plausible to exist and has fewer odd or impossible-looking things?
-
Which image better reflects the caption above them?
Interface Design
We have designed the annotation interface to be intuitive and accessible to users with little or no introduction. We make annotators choose between two displayed images, as this is deemed more intuitive than e.g. rating individual images. Thus, the base design consists of a criteria question at the top, with the two image options displayed below. Additionally, we introduce some variations to e.g. display the prompt for text-to-image alignment, and ensure higher data quality. The images below illustrate how the interface looks for different criteria.
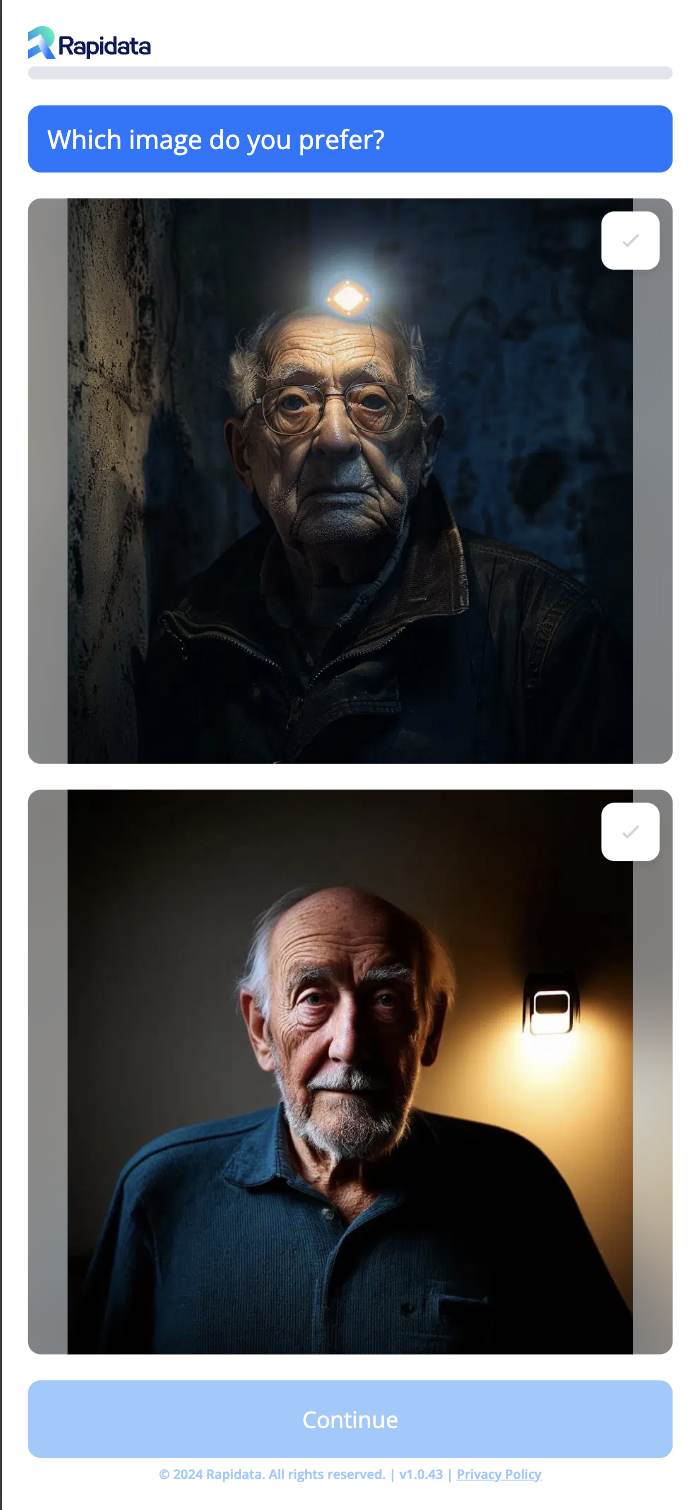
(A) Preference:
As criteria, the annotators are asked the question: 'Which image do you prefer?' displayed at the top. Below are the options; images generated by two different models. After selecting their preferred image, users can click 'Continue' to proceed.
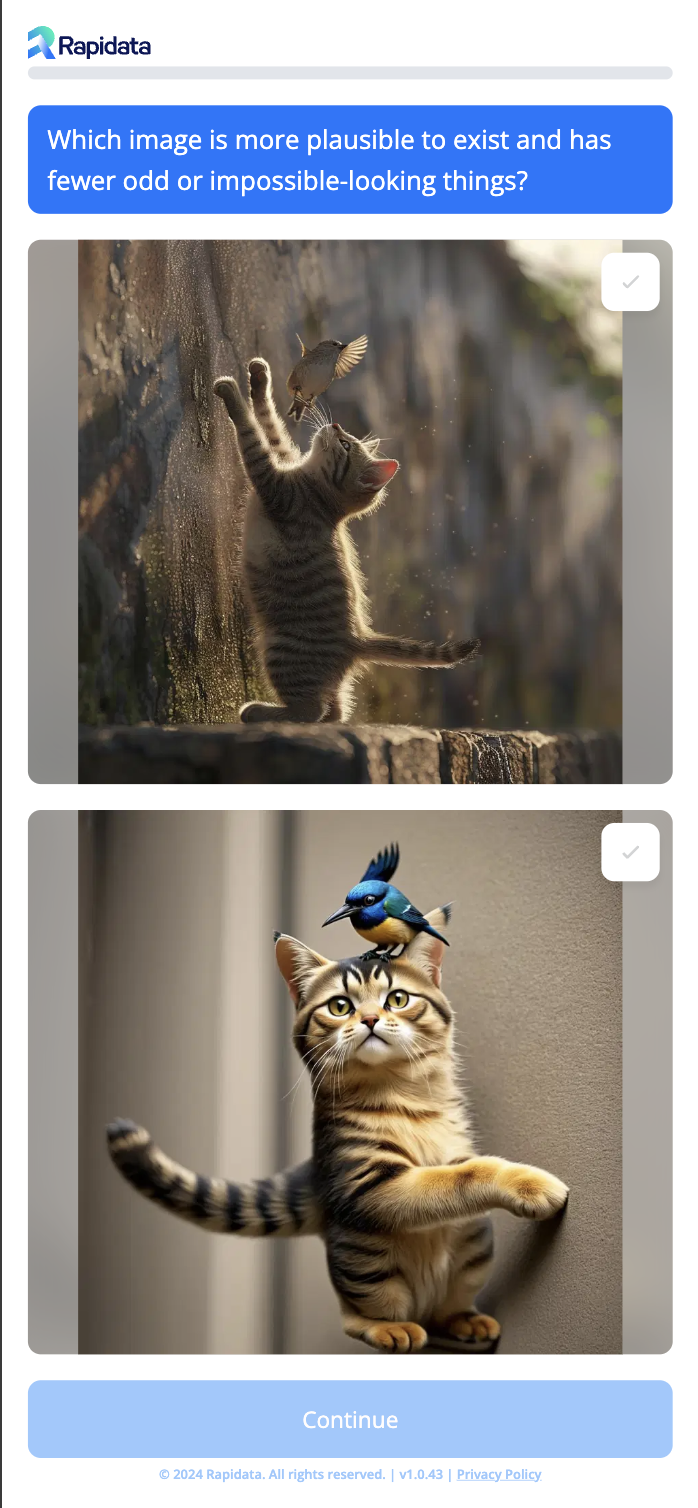
(B) Coherence:
Similar to the preference task, but with a different criteria question displayed at the top; ‘Which image is more plausible to exist and has fewer odd or impossible-looking things?'
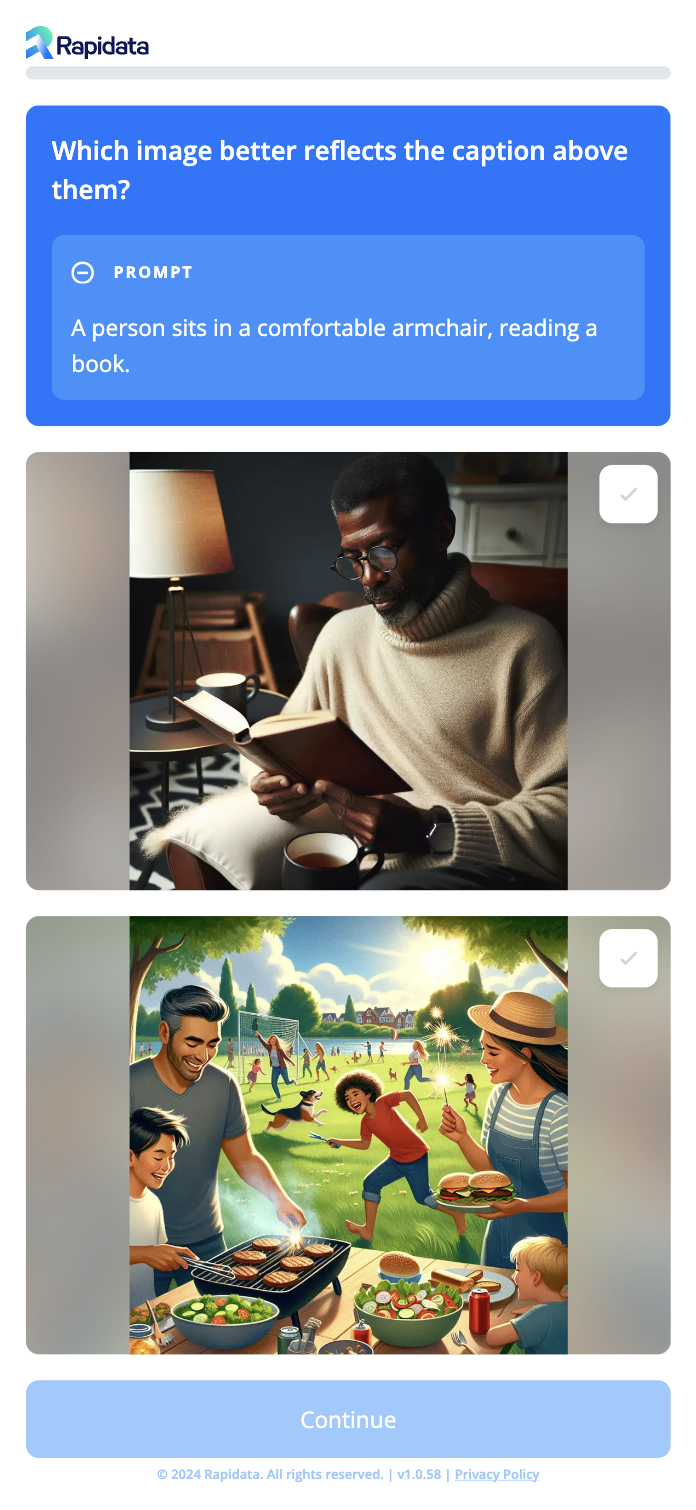
(C) Text-to-Image alignment:
The task is structured similarly to preference and coherence, with the criteria question,
'Which image better reflects the caption above them?' displayed. To provide the necessary context,
the prompt is displayed. The text is revealed quickly one word at a time to attract attention,
and users must confirm reading before the images are enabled for selection.
To improve efficiency, we group multiple comparisons into a single session. A session consists of a set of tasks assigned to an annotator in one sitting. Depending on difficulty, each session can include up to three tasks – all with the same criteria. This includes a potential validation task.
Distribution
Our annotation process leverages crowdsourcing techniques to gather detailed assessments from a broad and diverse user base. By distributing tasks through mobile apps we tap into a global pool of annotators across different demographics, geographic regions, and cultural backgrounds. This approach not only broadens the diversity of perspectives in the evaluations but also increases scalability, enabling us to handle large volumes of data in a cost-effective manner.
Quality Assurance
To enhance the reliability of the data collected we implement several quality control measures.
-
Time-Based Controls: A minimum expected time is set for completing each task. If a participant submits a response faster than this threshold, a time penalty is enforced. This discourages quick and thoughtless responses.
-
Validation Questions: To confirm that users are genuinely engaged, we incorporate validation tasks that are simple and intentionally straightforward, with an obvious correct answer. Annotators who do not successfully complete these tasks may be flagged for further review or disqualified from continuing to contribute.
-
Global Accessibility: To accommodate our diverse pool of global annotators, all tasks, including the prompts, are presented in the user’s default device language. This ensures that annotators can understand and engage with the tasks, regardless of their language background.
Prompts
The benchmark is organized into distinct categories, each tailored to evaluate critical attributes for assessing generative AI models. We base the input promptson the existing benchmark, DrawBench [6], however, to ensure a comprehensive evaluation, we enhanced it by integrating prompts from various complementary benchmarks. By including promps from DiffusionDB [7], ABC-6K [8], HRS-Bench [9], T2I-CompBench [10], and DALLE3-EVAL [11], we cover more nuanced attributes such as complex details, fidelity, emotion, bias, size, creativity, counting, color, actions, shapes, texture, and spatial/non-spatial relationships. In total, we use 282 prompts, which can be extended in the future.
Image generation
For image generation we used the same prompts across models, utilizing APIs where available. For Stable Diffusion we used the Hugging Face model. The following settings were used:
- Flux.1: Model: 'flux-pro', standard image quality, dimensions: 1024x1024 pixels.
- DALL-E 3: Model: 'dall-e-3', standard image quality, dimensions: 1024x1024 pixel dimensions.
- MidJourney (ImaginePro API): Model: 'MidJourney Version 5.2', aspect ratio: 1:1, minimal chaos, quality: 1, stylization: 100.
- Stable Diffusion: Model: 'stable-diffusion-3-medium-diffusers', guidance scale: 7.
Results
Data
For each prompt, we generate four images per model, which are compared against the images of the other models, resulting in 96 pairwise comparisons per prompt for each criteria. With three criteria, 282 prompts, and 26 votes per comparison, we collected over 2 million votes in total. Our research involved 144,292 participants from 145 countries, ensuring a diverse and global representation.
Ranking Algorithm
We used the Iterative Bradley-Terry ranking algorithm [12, 13] to rank models based on collected votes. This algorithm is well-suited when data is collected in full before determining the ranking, whereas e.g. Elo is a typical choice for online use cases, e.g. employed by Artificial Analysis in their Text-to-Image Arena [14]. The Bradley-Terry algorithm assigns probabilistic scores, , to each model, determining the probability of one model beating another in a pairwise comparison as . The scores are calculated iteratively using the formula:
where is the number of comparisons where model beat model . The final scores are normalized to sum to 100.
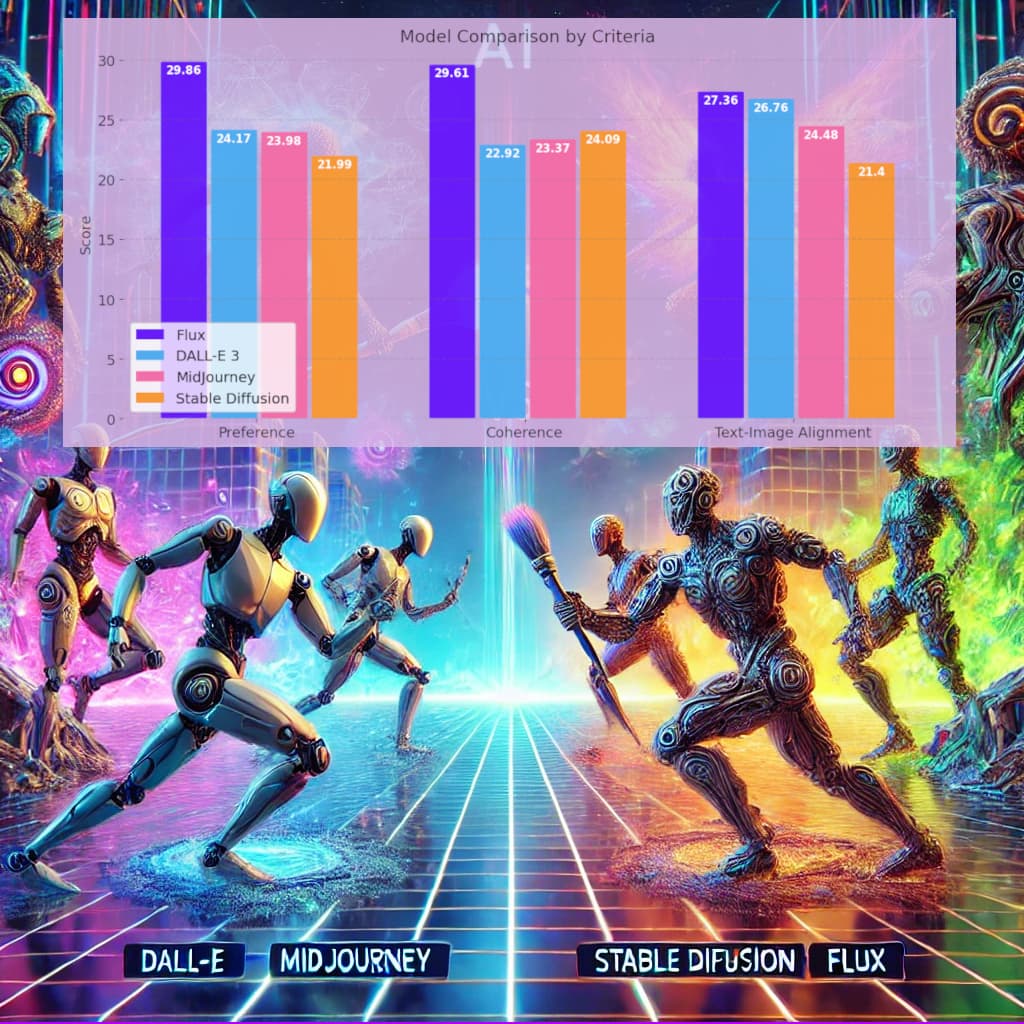
Ranking
The final ranking of the four models is summarized in the chart below.
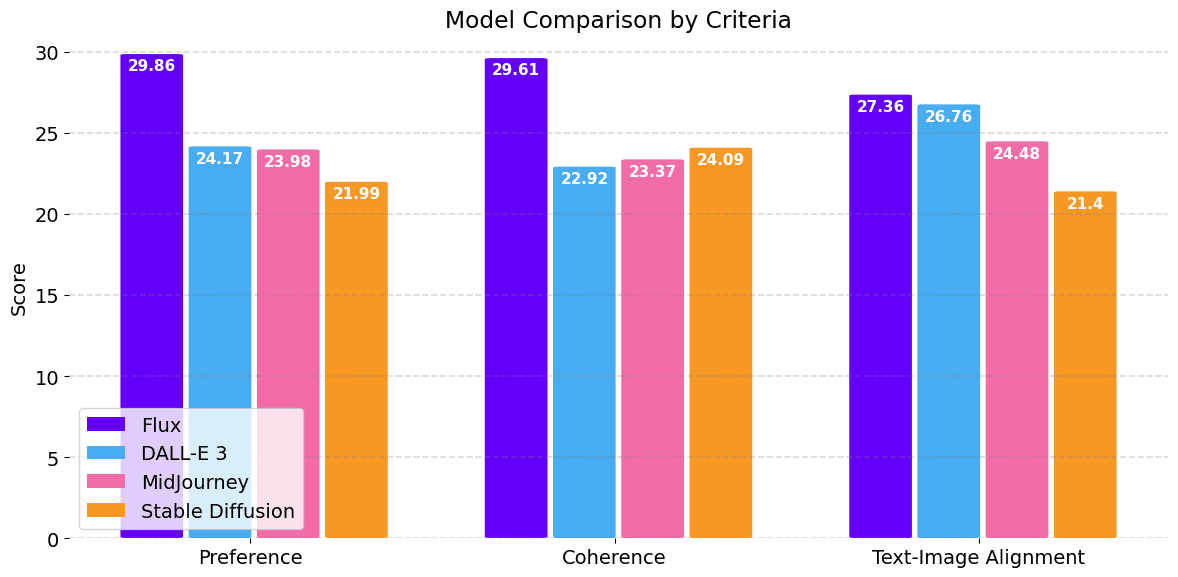
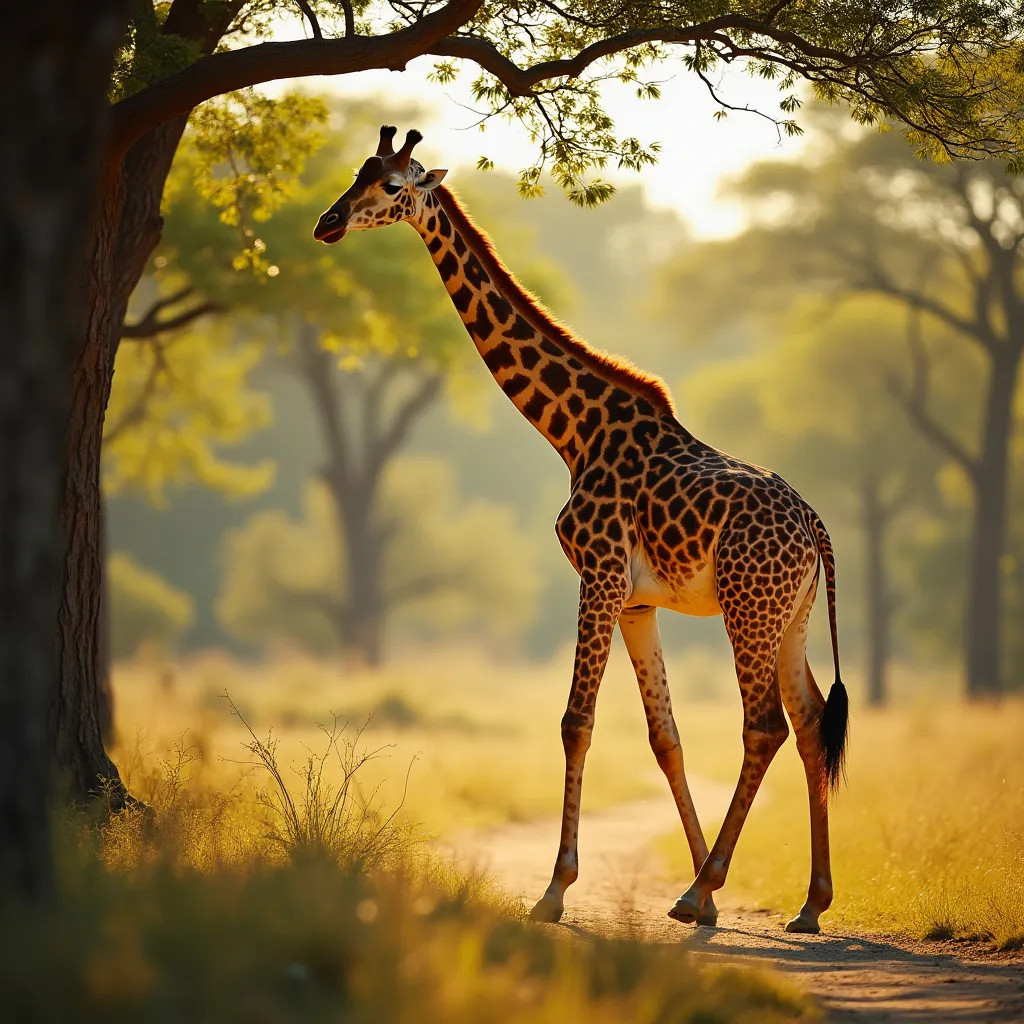
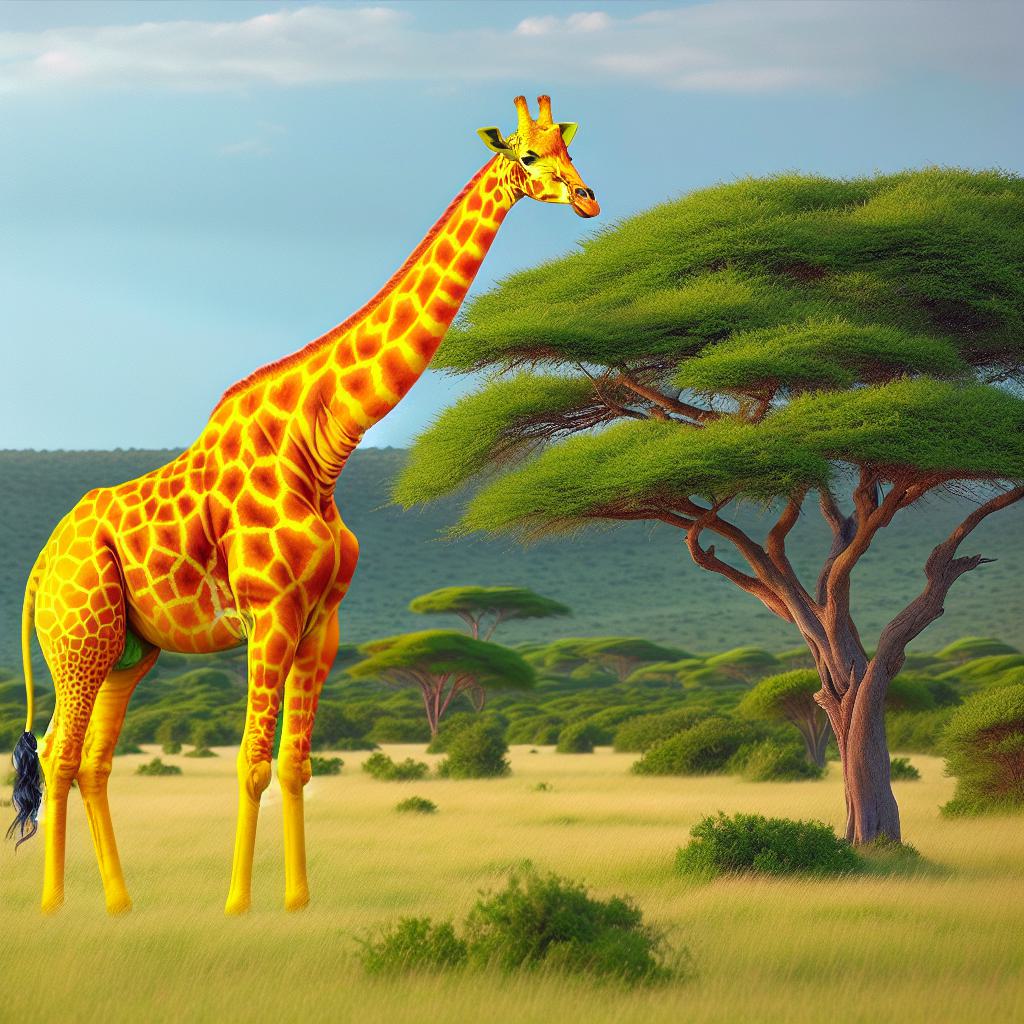
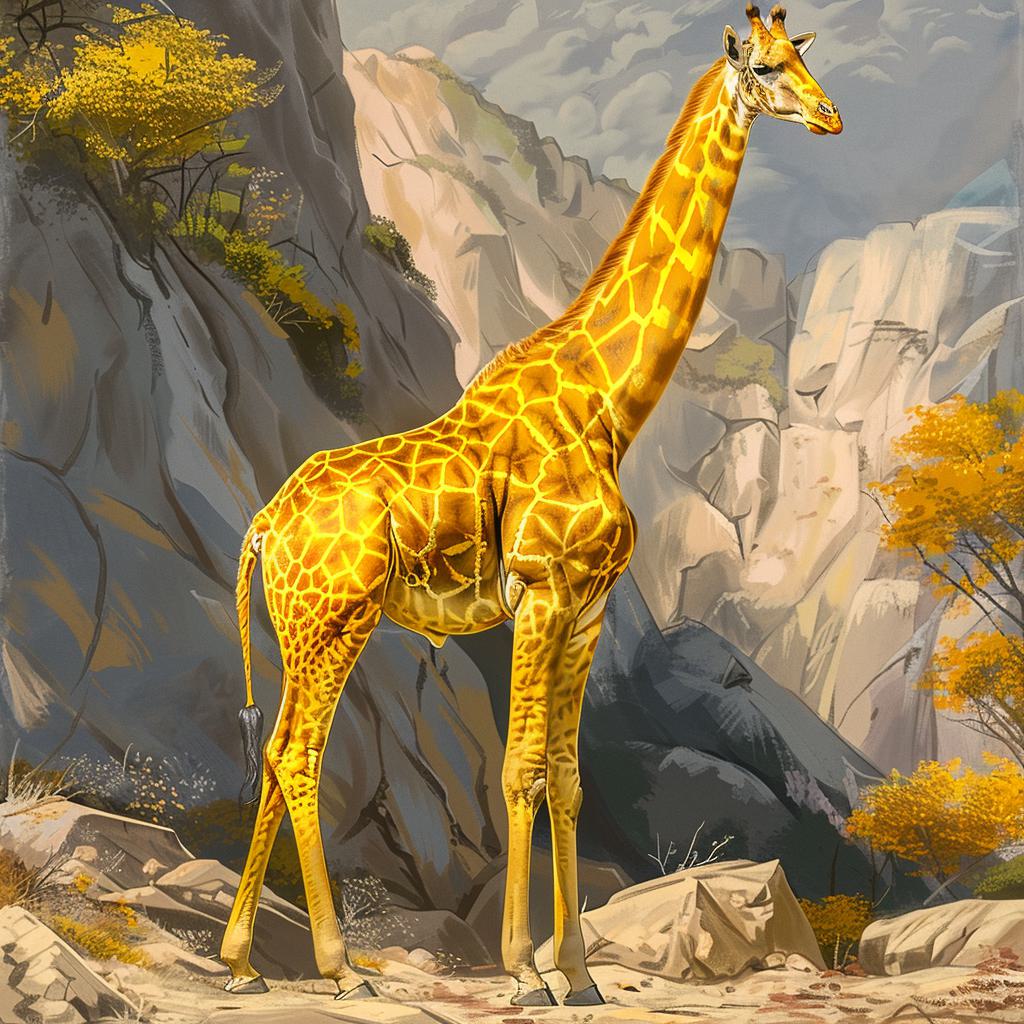
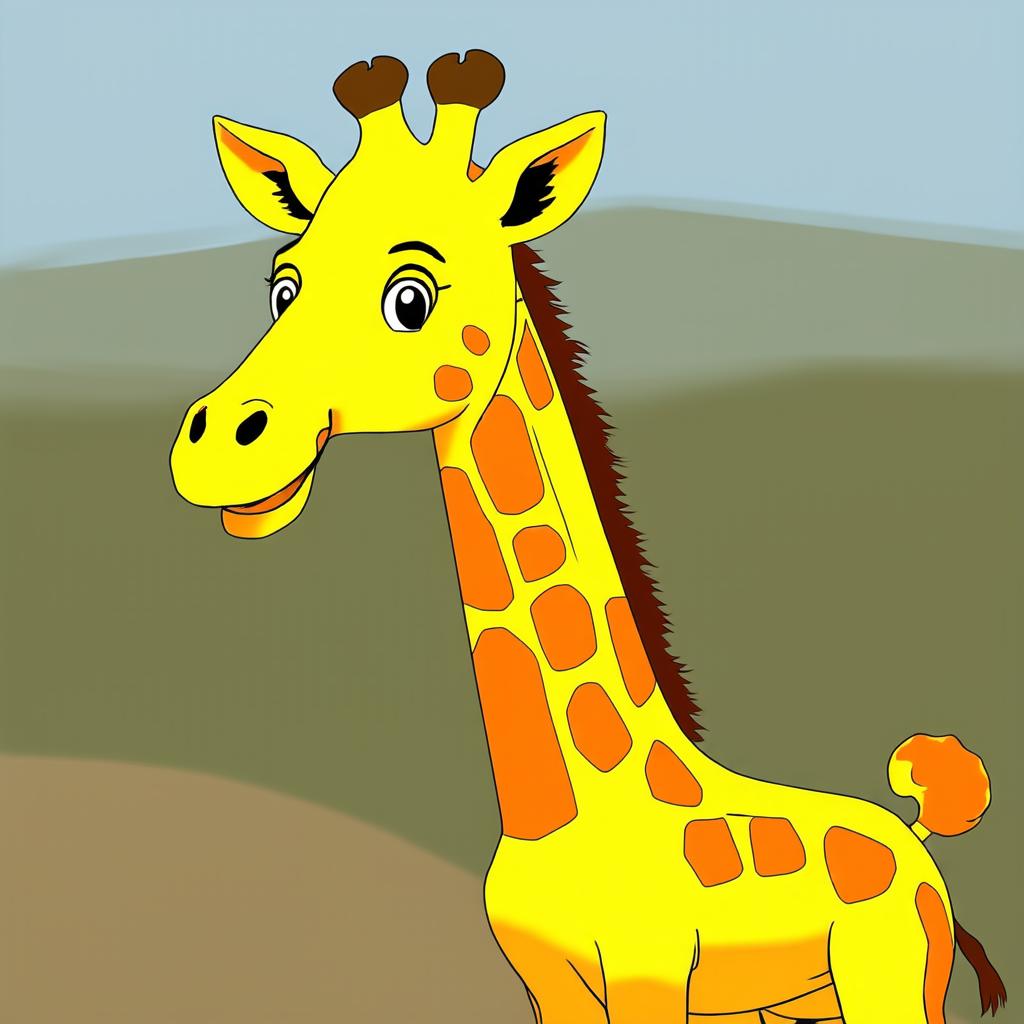
Preference: The newest model, Flux.1, significantly outperformed the other three in terms of style preference, DALL-E 3 and MidJourney performed similarly with Stable Diffusion trailing behind. While style preference is obviously subjective, the trend is somewhat illustrated in the example below.
Prompt: A yellow colored giraffe.
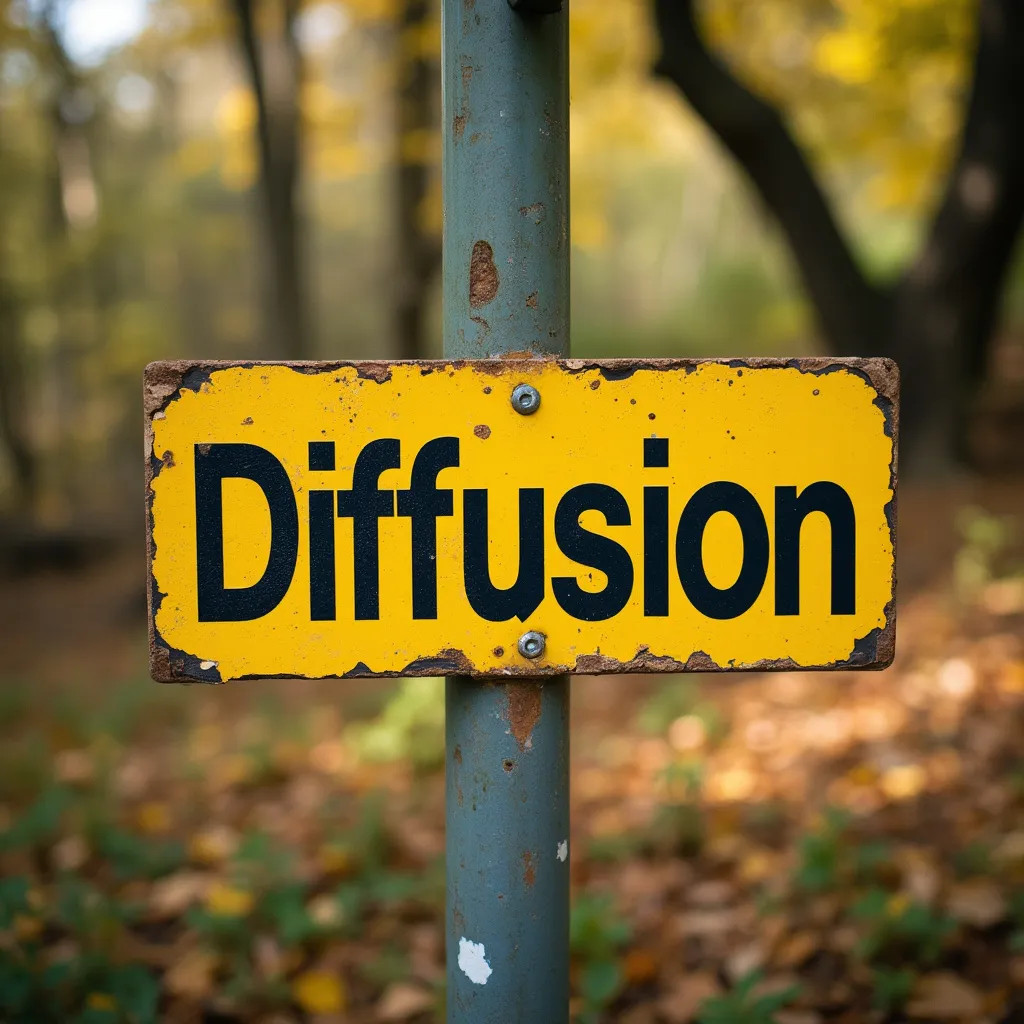
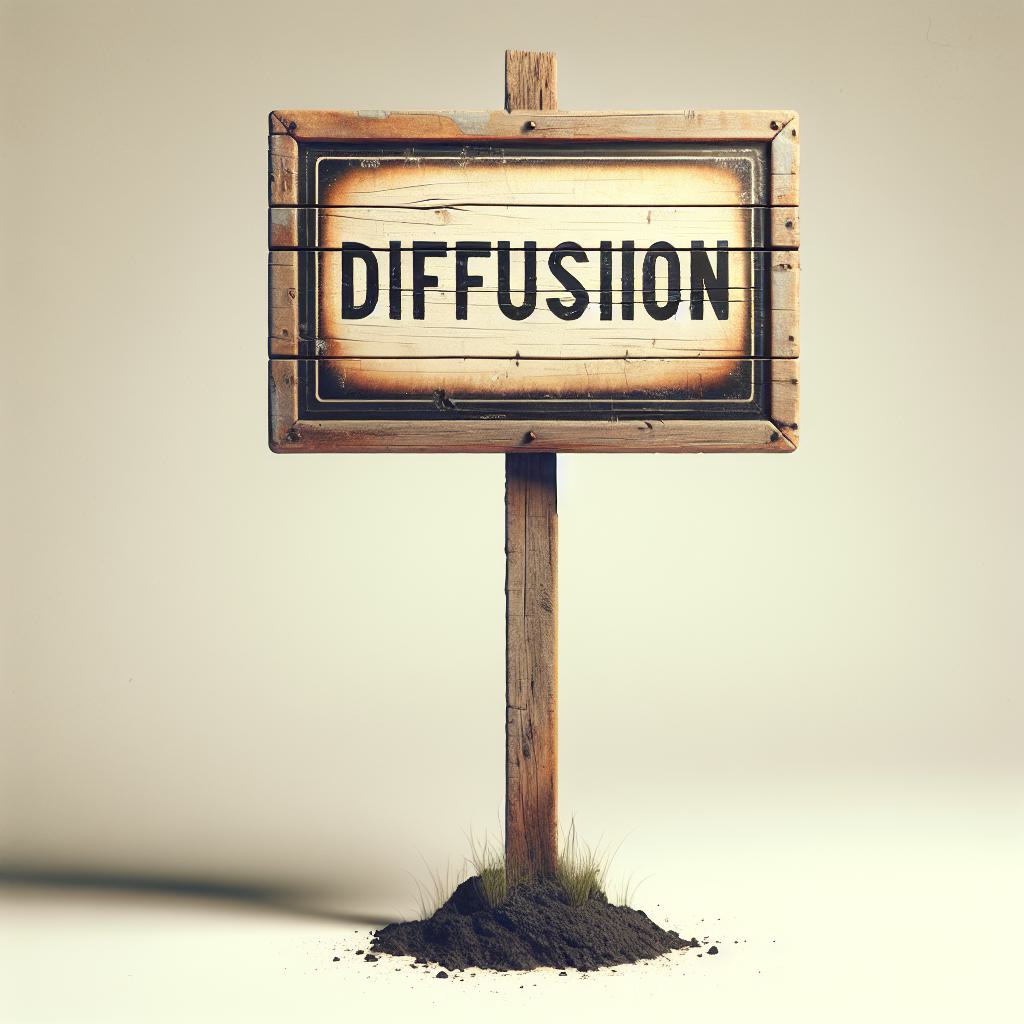
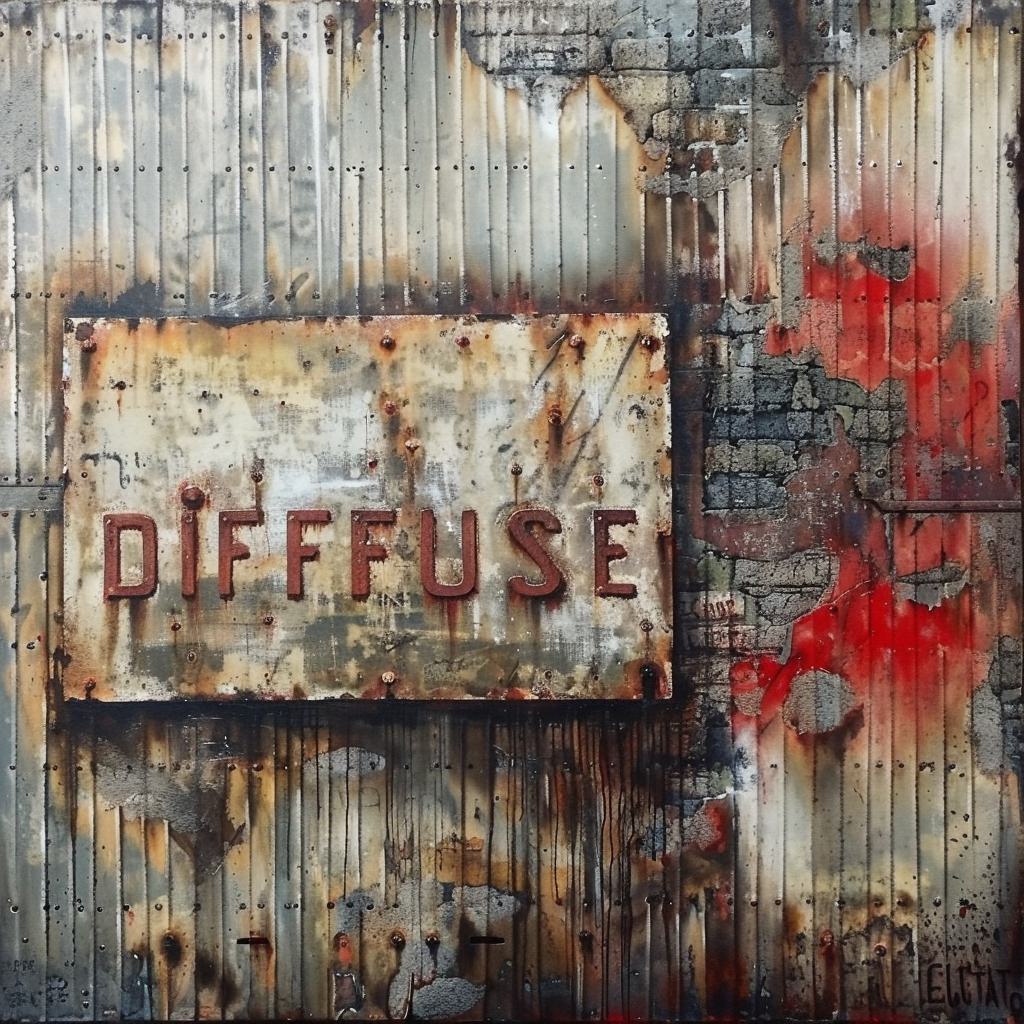
Coherence: Flux.1 again outperformed the others, however, interestingly Stable Diffusion scored higher than both DALL-E 3 and MidJourney for this criteria. This is surprising, but could be explained by the example below. Flux.1 generated a very realistic and plausible image, with DALL-E 3 and MidJourney slightly less so. Stable Diffusion, however, produced an image very realistic and plausible, but completely disregarded the prompt.
Prompt: A sign that says 'Diffusion'.
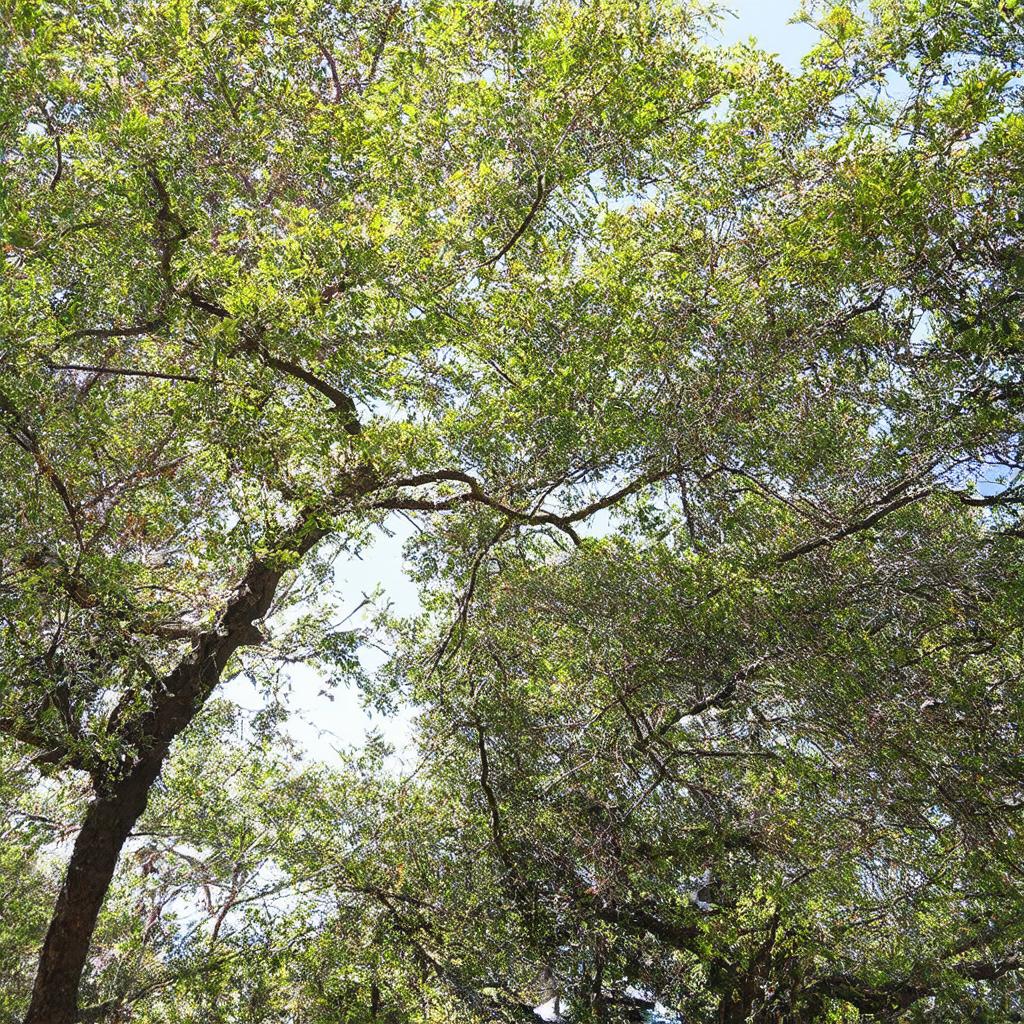
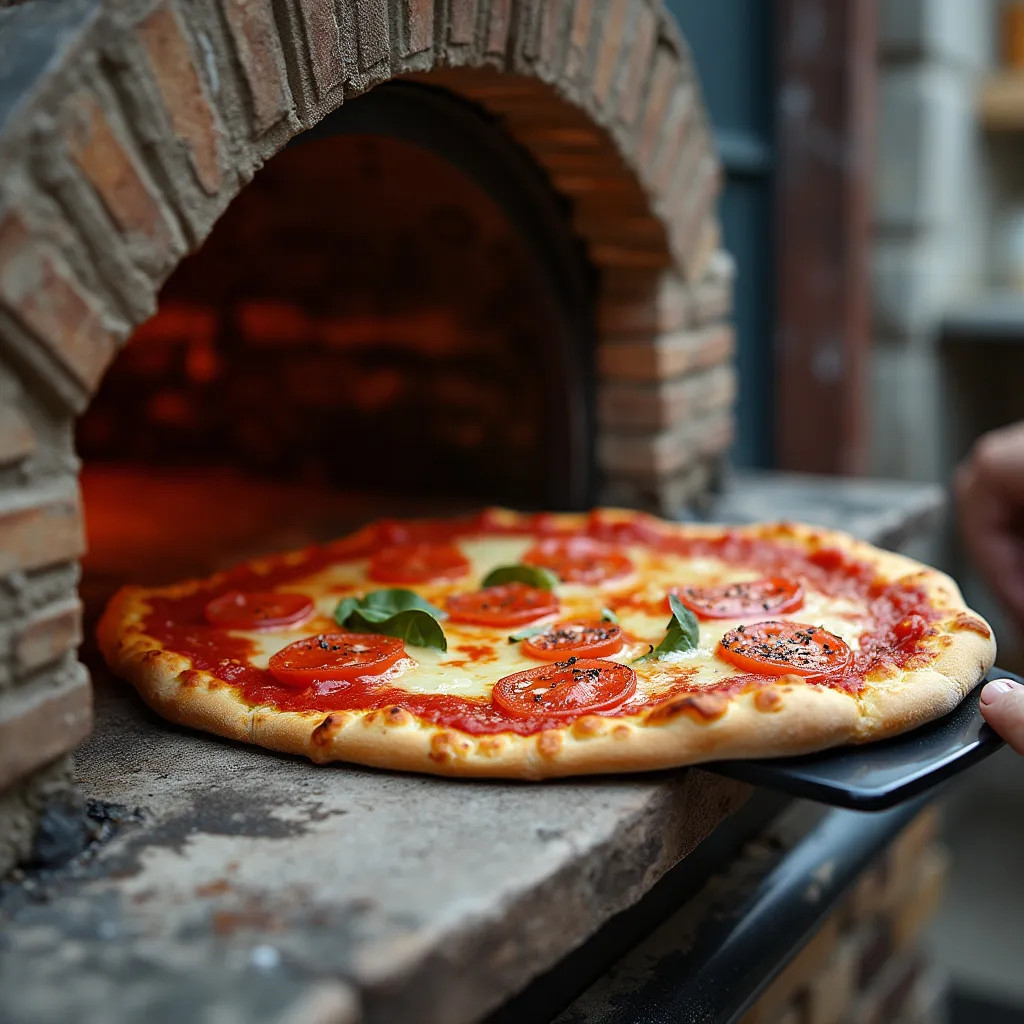
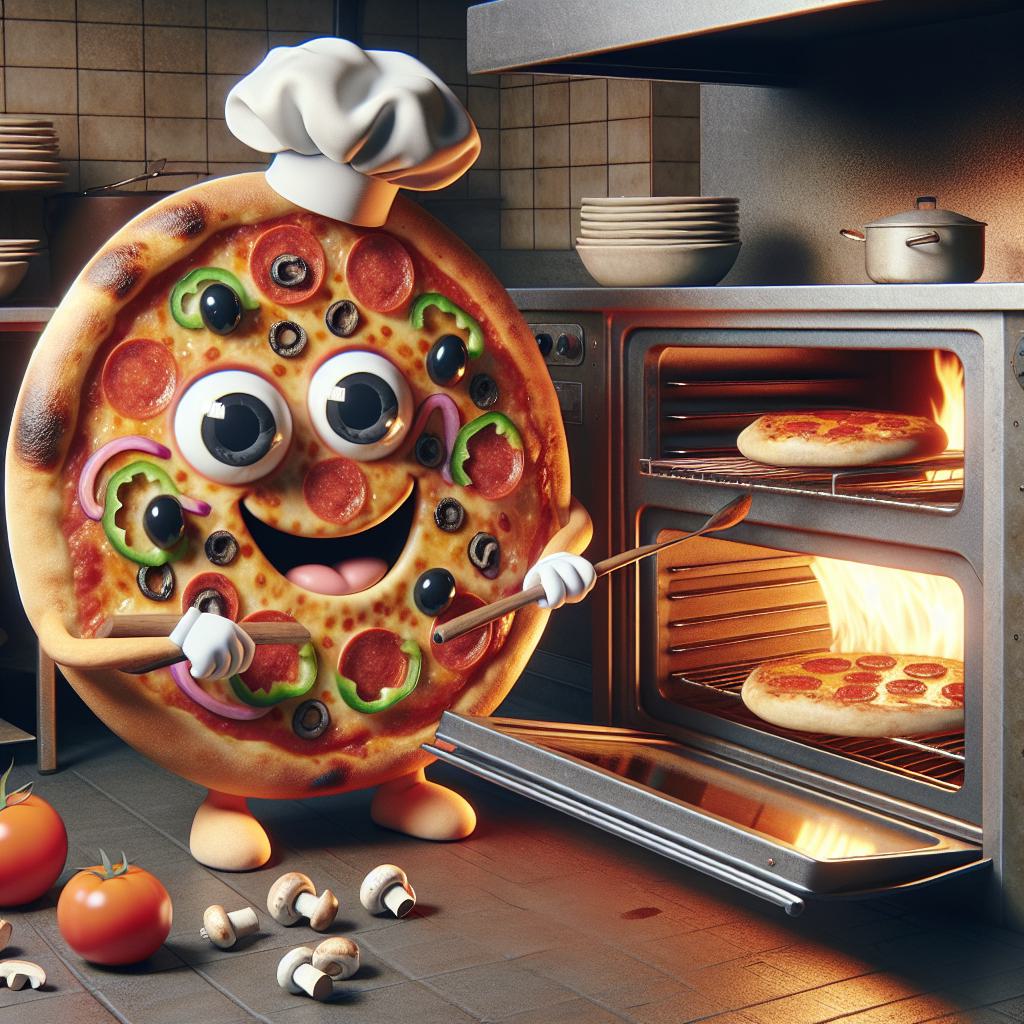
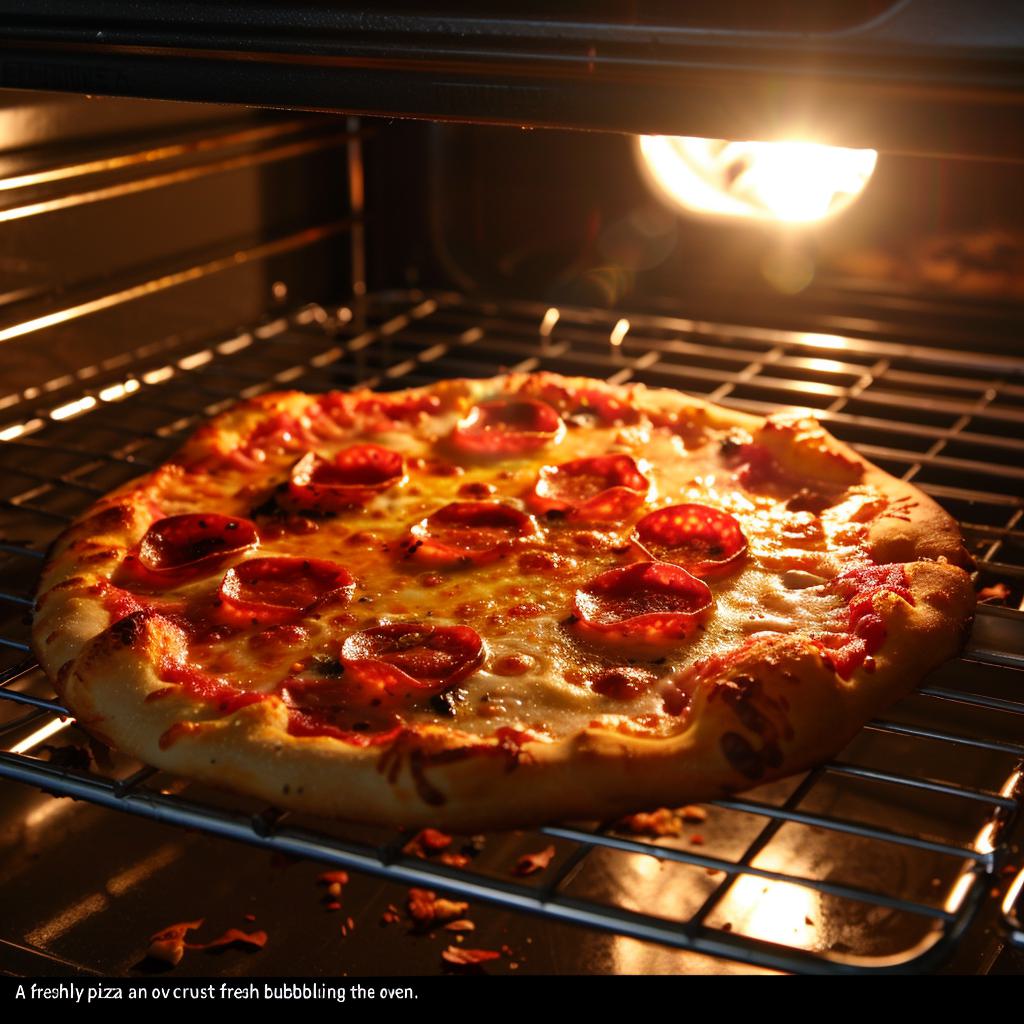
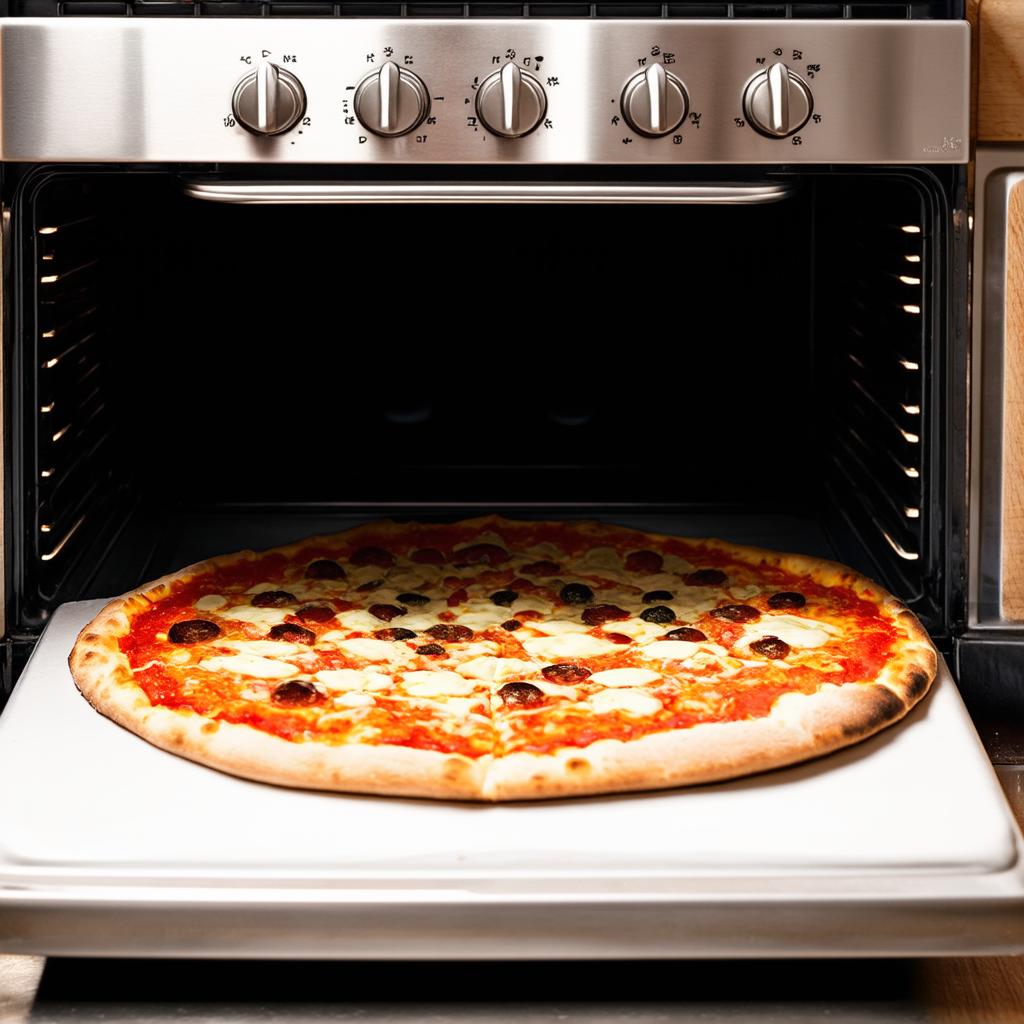
Text-to-Image Alignment: The Flux.1 model comes out on top again, however with only a small gap to DALL-E 3. The two examples below may help explain this. In cases of typos and odd sentences, it appears to us that DALL-E 3 interprets the prompts more 'correct' nad 'intuitively'. In the first example only DALL-E 3 captures the aspect that the pizza is the subject doing the cooking. The other model appear to have interpreted the prompt as 'A pizza cooking in an oven'. In the second example, DALL-E 3 interprets the misspelled prompt as 'Tennis racket' whereas Flux.1 seemingly focuses on 'packet' part of 'Tcennis rpacket'.
Prompt: A pizza cooking an oven.
Prompt: Tcennis rpacket.


Based on the results we can highlight some strengths and weaknesses among the evaluated models:
- Flux.1: Top performer across all criterias, and by a significant margin in both style preference and coherence. This firmly cements that this should be the default choice for most applications. This is in line with what newer benchmarks which include Flux.1, such as the leaderboard from Artificial Analysis, report. [14]
- DALL-E 3: The best performance was in terms of text-to-image alignment, although still trailing behind Flux.1. It was however the worst model in terms of producing coherent images. While there is currently little reason to choose DALL-E 3 over Flux.1, if the main focus is text-to-image alignment for odd and abstract prompts, it might in some cases be an equal or better choice.
- MidJourney: This model does not excel at any of the criterias but also is never the worst.
- Stable Diffusion: Shows relatively lower performance in all evaluated criterias, however, it remains competitive in image coherence, suggesting that it is better suited for tasks prioritizing internal consistency over user preference or text alignment.
Demographic Statistics
With our proposed benchmark and annotation framework, we aim to improve global representation to reduce biases. We therefore present and analyze demographic data of the participating annotators. We present three statistics; geographic location, age group, and gender.
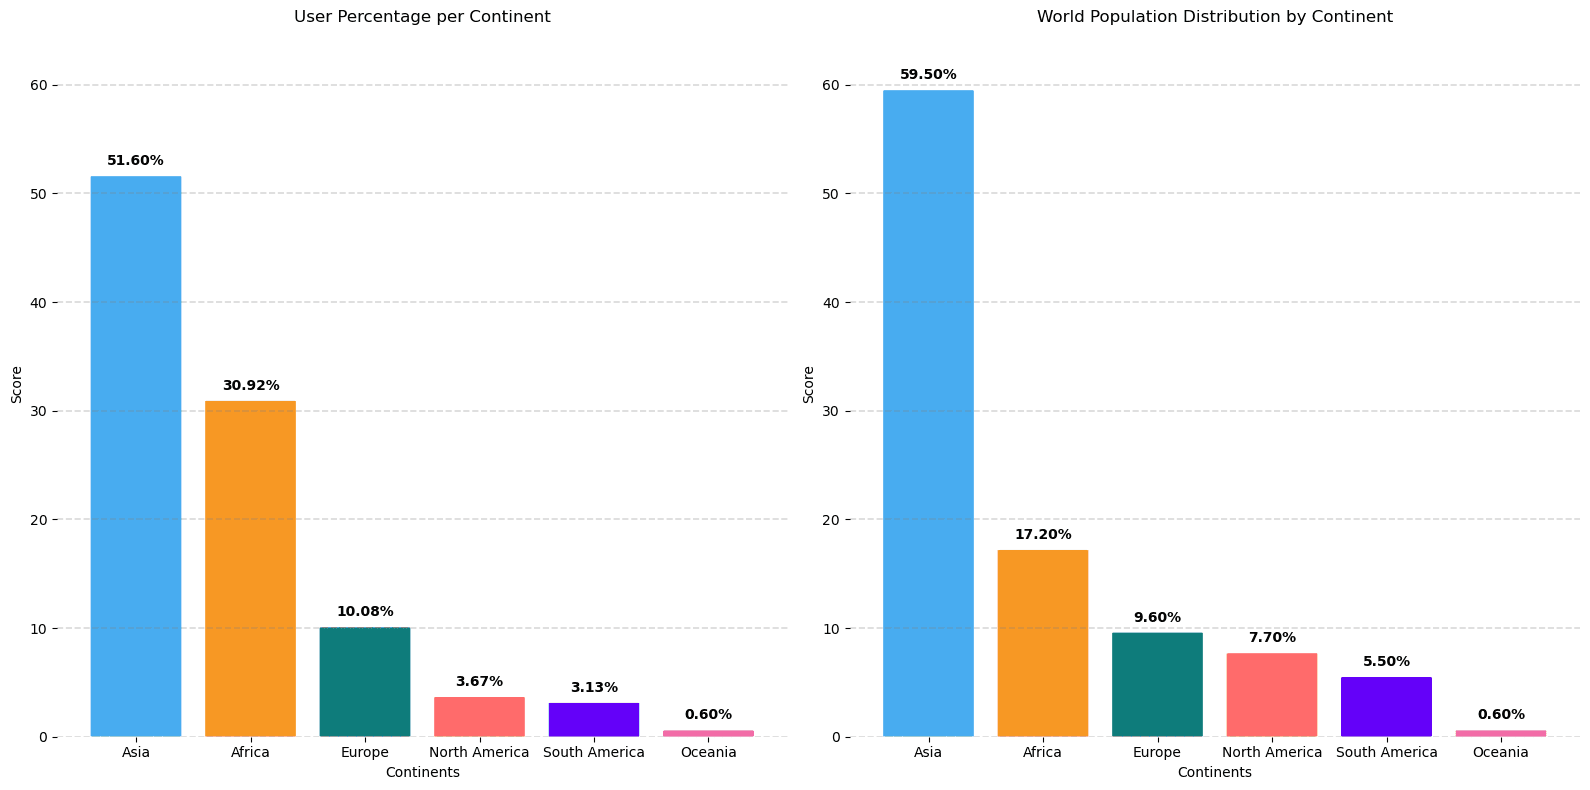
Location: For simplicity and visualization, we break down location by continent. In the figure below we see that our distribution captures the trend of the global population, with a slight overrepresentation of Africa and Europe, and a slight underrepresentation of Asia and North America. The underrepresentation of North America may be offset by the cultural similarity to Europe. The distribution is overall a reasonable estimate of the world population, and underlines the argument that our proposed framework reaches a diverse set of annotators to reduce biases. For future work, we can adjust this, as our tool allows us to target specific countries or even languages.
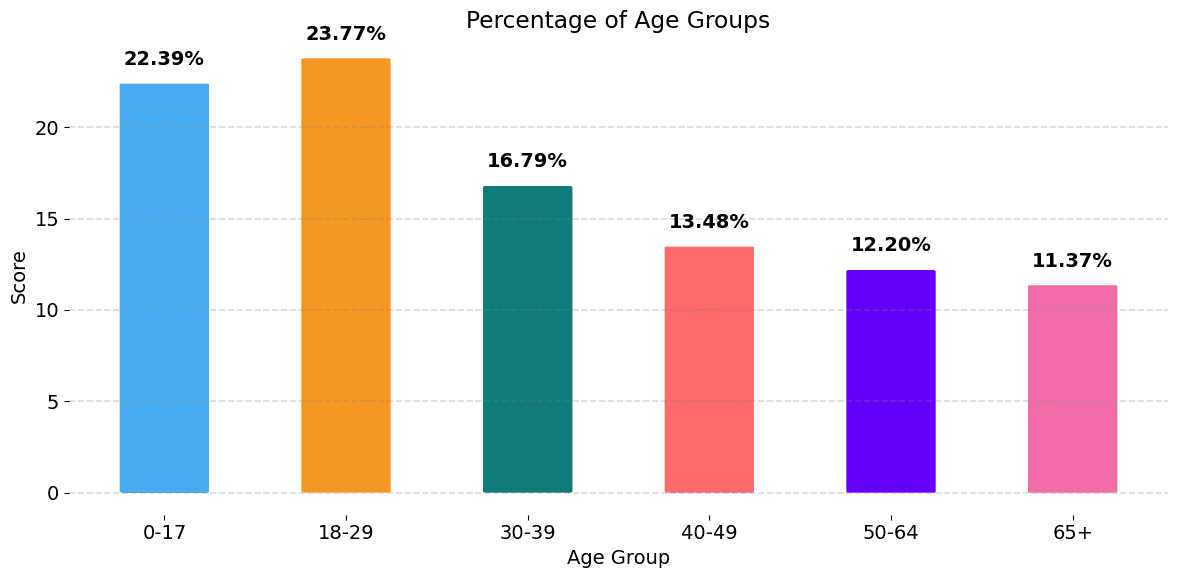
Age: From the figure below, we observe a higher representation of younger annotators, which is probably to be expected from the crowd-sourcing method. Overall however, the distribution is quite even.
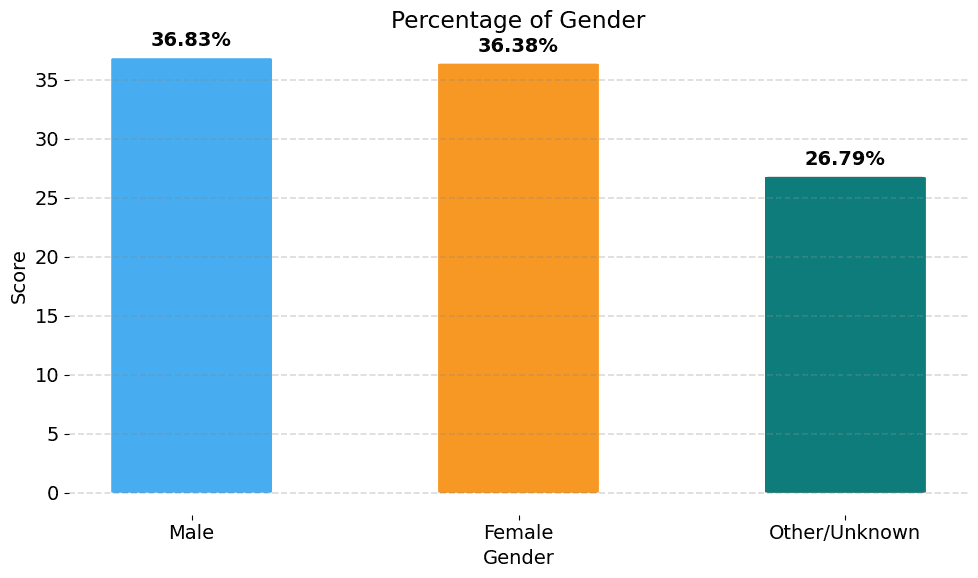
Gender: The graph illustrates the gender distribution of users who participated in the evaluation. We observe a very even distribution between men and women. However, we also observe a large portion that answered another category or did not provide an answer.
Conclusion
Our annotation framework and proposed benchmark provides an efficient, representative, and scalable way to comprehensively evaluate image generation models. This is only possible through the novel crowd-sourcing approach made accessible through Rapidata’s technology. In the scope of just a few days, we cost-effectively collected more than 2 million responses – to the best of our knowledge, the largest image generation model evaluation by a significant margin.
The scale and efficiency illustrated in this work also opens the door for human feedback directly in the AI training process. Reinforcement learning from human feedback (RLHF) has been a significant driver in bringing LLMs to the level we see today. Rapidata’s technology provides easy access to diverse, efficient, and scalable feedback to include humans in the training loop.
References
[1]: Betker et al. (2023). DALL-E 3 Improving Image Generation with Better Captions https://cdn.openai.com/papers/dall-e-3.pdf
[2]: Rombach et al. (2022). High-Resolution Image Synthesis with Latent Diffusion Models https://arxiv.org/pdf/2112.10752
[3]: Nichol et al. (2022). GLIDE: Towards Photorealistic Image Generation and Editing with Text-Guided Diffusion Models https://arxiv.org/pdf/2112.10741
[4]: Lin et al. (2023). DEsignBench: Exploring and Benchmarking DALL-E 3 for Imagining Visual Design https://arxiv.org/pdf/2310.15144
[5]: ALHABEEB et al. (2024). Text-to-Image Synthesis With Generative Models: Methods, Datasets, Performance Metrics, Challenges, and Future Direction https://ieeexplore.ieee.org/stamp/stamp.jsp?tp=&arnumber=10431766
[6]: Saharia et al. (2022). ImagenHub Photorealistic Text-to-Image Diffusion Models with Deep Language Understanding, https://arxiv.org/abs/2205.11487
[7]: Wang et al. (2023). DiffusionDB: A large-scale prompt gallery dataset for text-to-image generative models, https://arxiv.org/abs/2210.14896
[8]: Feng et al. (2023). ABC-6K Training-free structured diffusion guidance for compositional text-to-image synthesis., https://arxiv.org/abs/2212.05032
[9]: Bakr et al. (2023). HRS-Bench: Holistic, Reliable and Scalable Benchmark for Text-to-Image Models, https://arxiv.org/abs/2304.05390
[10]: Huang et al. (2023). T2I-CompBench: A Comprehensive Benchmark for Open-world Compositional Text-to-image Generation, https://arxiv.org/abs/2307.06350
[11]: DALLE3-EVAL https://github.com/openai/dalle3-eval-samples
[12]: Newman (2023). Efficient Computation of Rankings from Pairwise Comparisons https://jmlr.org/papers/v24/22-1086.html
[13]: Bradley-Terry Model https://en.wikipedia.org/wiki/Bradley%E2%80%93Terry_model
[14]: Artificial Analysis. Text-to-Image Arena: https://artificialanalysis.ai/text-to-image/arena